One Percent.
Small Business Expense Tracker Spreadsheet | Excel & Google Sheets | Auto-Categorizing Dashboard with Pie Chart (Digital)
Small Business Expense Tracker Spreadsheet | Excel & Google Sheets | Auto-Categorizing Dashboard with Pie Chart (Digital)
Couldn't load pickup availability
Stop hunting through bank statements to figure out where your money went.
The One Percent Expense Tracker is a plug-and-play spreadsheet that turns bill-paying into a 30-second task and gives you a live dashboard showing exactly where every dollar is going. Built for small businesses, contractors, agencies, and home-service companies who've outgrown sticky notes but aren't ready for full accounting software.
What you get
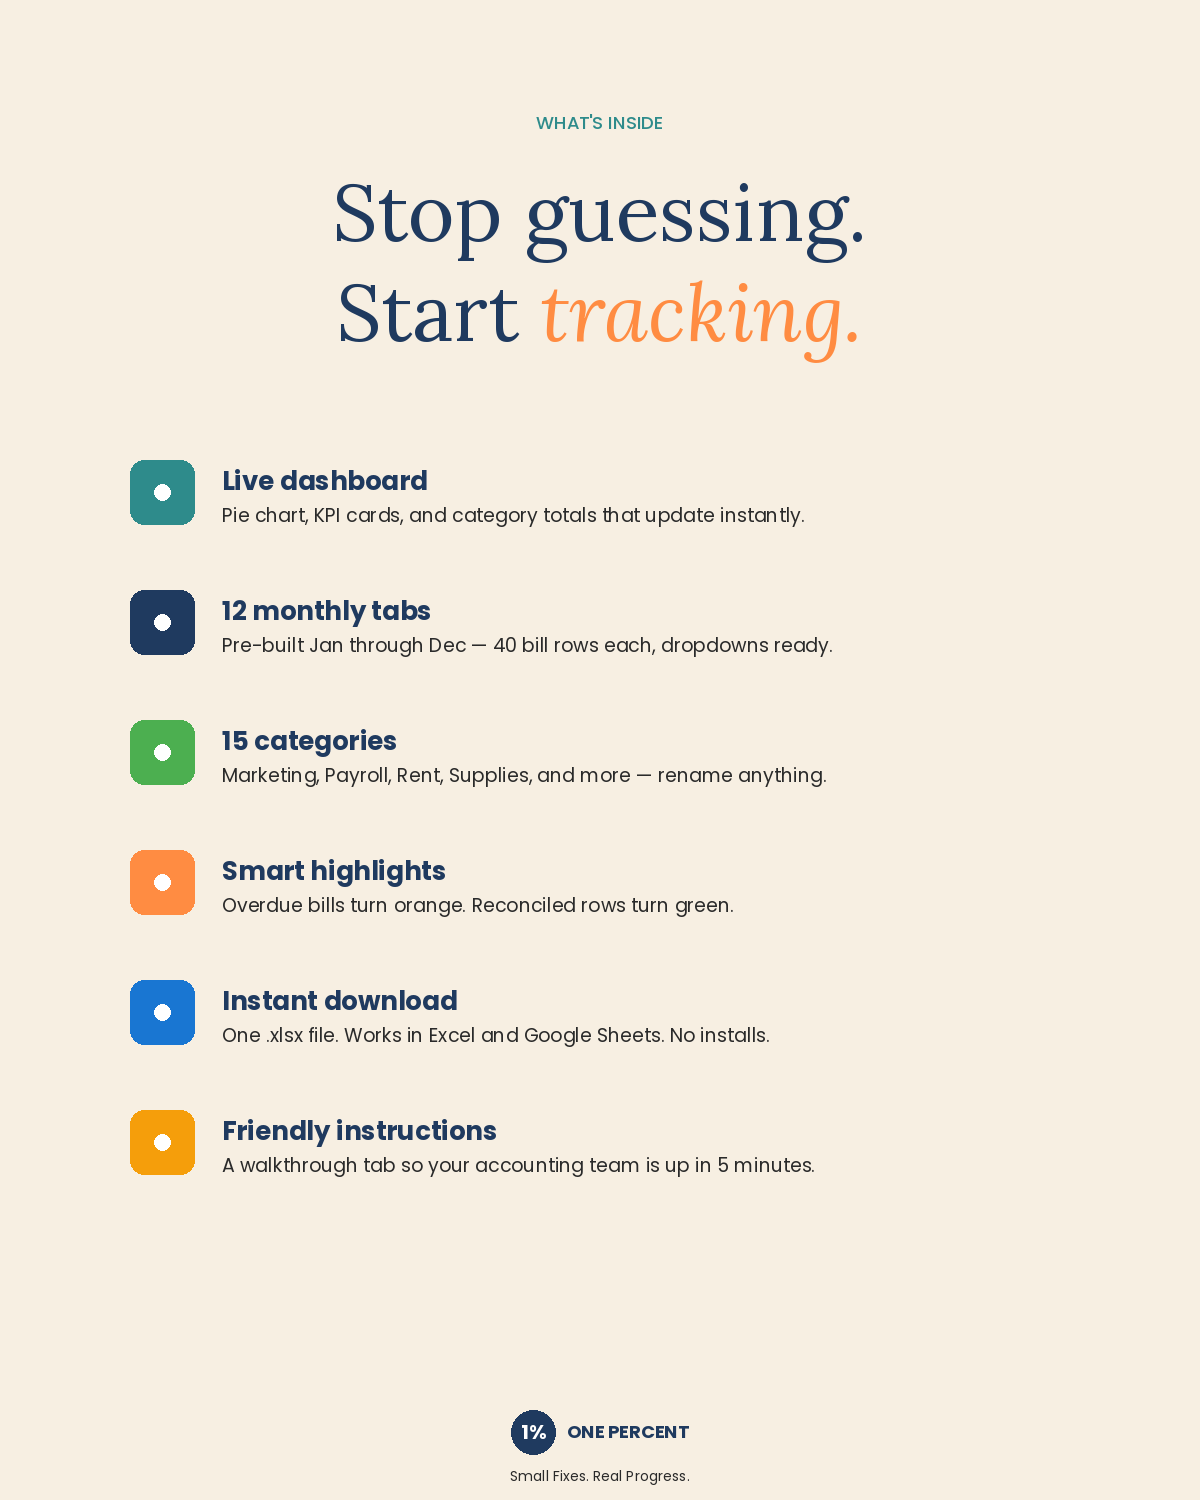
- Live dashboard with a hero pie chart, four KPI cards (Total Expenses, Bills Paid, Avg Bill, Top Category), and a full category breakdown table — all updating automatically as your team logs bills
- 12 monthly tabs (Jan through Dec) with 40 bill rows each — log the date, vendor, description, category, payment method, reference #, due date, amount, and reconciled status
- 15 pre-built expense categories — Marketing, Supplies, Rent/Utilities, Gas/Fuel, Labor, Payroll, Office Payroll, Insurance, Professional Services, Software/Subscriptions, Repairs/Maintenance, Travel/Meals, Bank Fees, Taxes, and Other. Rename any of them to match how your business actually talks about its costs — dropdowns and the dashboard update everywhere automatically
- Smart features built in: dropdown menus, reconciled checkboxes that color-code green/red, automatic orange highlighting on overdue bills, monthly mini-dashboards on every tab, and clean empty-state formatting (no $0.00 noise)
- Friendly instructions tab that walks your accounting team through everything — from logging a first bill to starting a new year
Who it's for
Small business owners, bookkeepers, accounting departments, and operations managers who want clear visibility into spending without a learning curve. Perfect for service businesses, trades, agencies, freelancers, and any company in that awkward middle ground between Excel chaos and QuickBooks overkill.
How it works
Open the file. Pick the monthly tab that matches when you paid the bill. Fill in one row per bill (vendor, category from the dropdown, amount). Done. Your dashboard pie chart, category totals, and KPIs update live. At month-end, your accountant has a clean record. At year-end, you can spot exactly which categories ballooned and which stayed in check.
Technical details
- Works in Microsoft Excel (Windows, Mac, web) and Google Sheets
- One .xlsx file — instant download after purchase
- No subscriptions, no installs, no logins
- Reusable year after year — duplicate, clear, rename, go
About One Percent
We help small businesses improve one process at a time. This Expense Tracker is part of our entry-level spreadsheet line, alongside our Sales Dashboard and Purchase Order Tracker. Need something more custom — project codes, multi-entity, integrations, branded version for your team? Visit onepercentup.com or message us. Small Fixes. Real Progress.
Share